3

Patent Application: **US20140019842 from Bank of America reminds me a lot of Software from Tableau. I'm looking for a Tableau or other reference which can be given to the patent examiner to help block or narrow this patent application.

Overview: "A set of measure/dimension boxes in an "available fields" region, which can then be dragged to "Row" or "Column" region."

QUESTION - Have you seen anything that was published before 7/11/2012 that discusses:

Claim 1 is:

  1. An apparatus, comprising: a processor operable to:

    • Determine a plurality of field identifiers of a data set, the data set comprising a plurality of data entries, a data entry comprising one or more data values, a data value associated with a field identifier of the plurality of field identifiers;

    • Generate a plurality of field cells that each correspond to a field identifier of the plurality of field identifiers;

    • Display the plurality of field cells within an available fields region; and

    • Display a column field region and a row field region, the column field region operable to define one or more columns of a pivot table, the row field region operable to define one or more rows of the pivot table; and an interface operable to accept a first input from a user; and

      Wherein the processor is further operable to:

    • Move a first field cell of the plurality of field cells from the available fields region to the column field region or the row field region in response to the first input from a user; and

    • Update the pivot table to include one or more rows or columns corresponding to the first field cell upon detection of the movement of the first field cell to the column field region or the row field region.

FIGURE FROM PATENT APPLICATION IN QUESTION
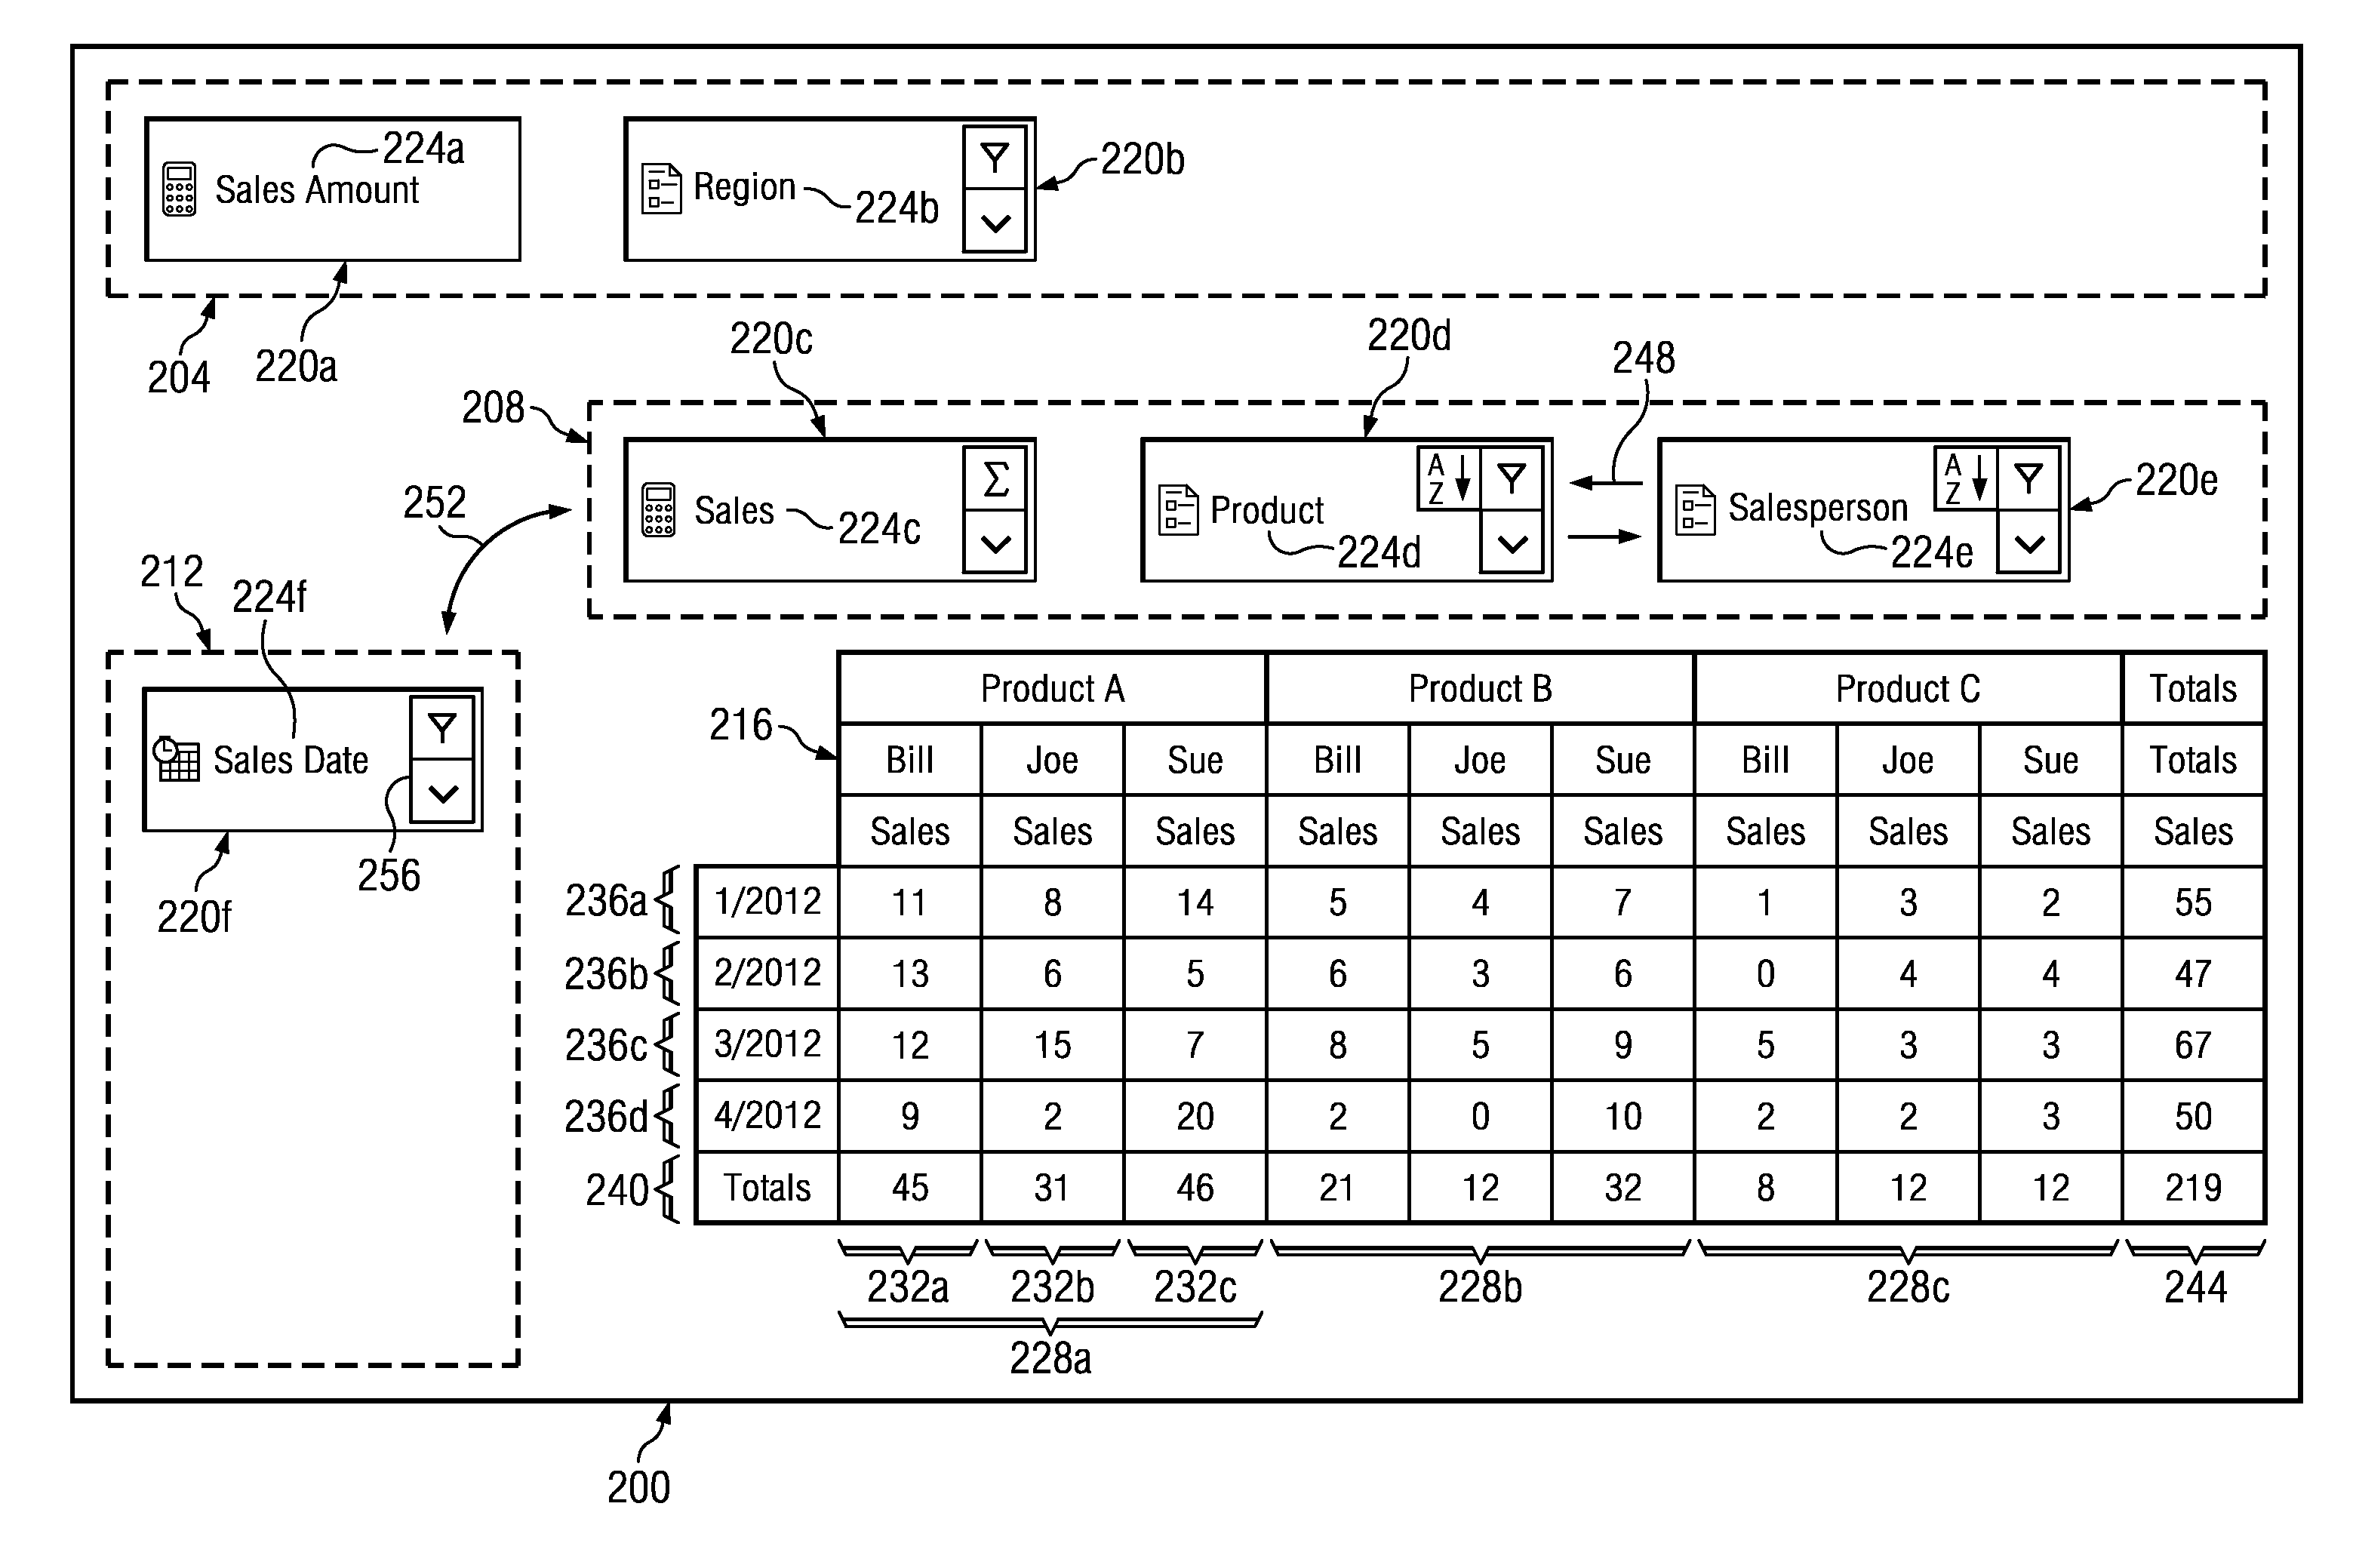
enter image description here

vs

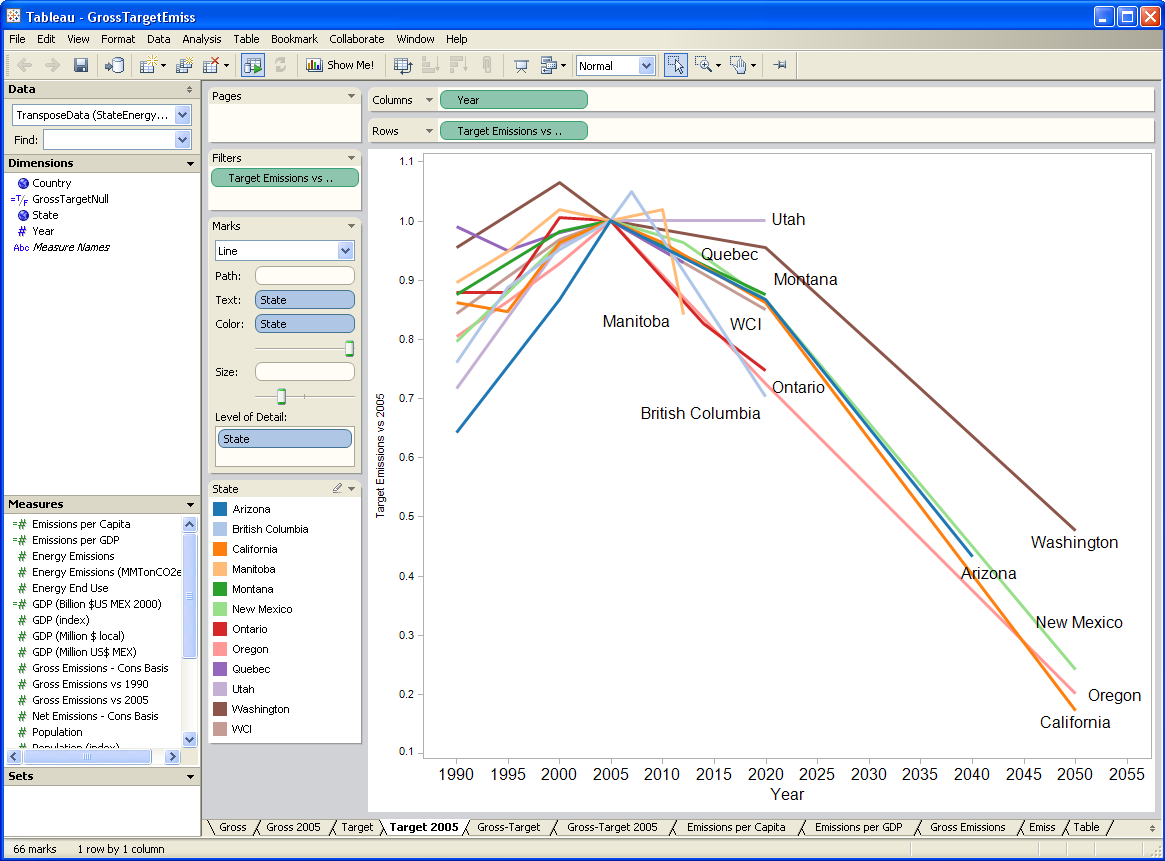
FIGURE FROM "Tableau"

enter image description here

Question: Can anyone find a reference to patents from Tableau (or any other company) which predates the subject patent application from Bank of America (filed 7/11/2012). It definitely does not seem novel to me.


What is good prior art? Please see our FAQ.

Want to help? Please vote or comment on submissions below. We welcome you to post your own request for prior art on other questionable US Patent Applications.

1
  • 2
    Isn't this just Excel pivot tables? A feature that dates back to the mid-1990s? Commented Jan 23, 2014 at 1:03

4 Answers 4

4

This is a direct copy of the Pivot Tables feature from Excel which was introduced in Excel 5.0, approximately 1995.

Here is a PDF document describing Pivot Tables as they are implemented in Excel 2003 which clearly teaches all of the technology in the claim.

2
  • I thought this too at first but I think it's something different which I'll put in an answer because it's too many characters.
    – Elin
    Commented Jan 24, 2014 at 3:39
  • agree with @Elin .. it's pivot tables, but with one or two things to tack on to. I added a few bits also in a separate answer. lol... we could all combine into one community answer Commented Feb 5, 2014 at 16:15
1

Almost every "OLAP tool" around 2005 had some kind of pivot table (which almost but not quite looked like Excel) with slightly different user interfaces.

A good candidate seems to be "Holos" by Seagate Software / Crystal Decisions / Business Objects which is now discontinued:

http://resources.businessobjects.com/support/communitycs/TechnicalPapers/worksheet.pdf

0

I see a couple of things. One is that they are just putting some of the UI in different places, the columns to the left of the table and the rows above and "in the same window' as the table, as opposed to in a separate window the way it is in Excel. Also notice how it's not just a list of fields, it's a box with all the properties.

(And they seem to claim the color thing is important, not sure what that is about).

I think we'd want to find something that that same window feature.

I don't know that all of that is new different enough, but it is definitely different. But, I'm thinking there probably is something else out there that isn't Excel. I haven't looked at Tableau yet but that could be it.

The date on the first github commit of this is too late, but I think this is in line with that they are talking about, http://nicolas.kruchten.com/pivottable/examples/mps_prepop.html

0

Google Analytics Dashboard/Reporting UI is your best bet to block this one. I'm fairly certain there was a demo of their tool at I/O 2010 or earlier? that showed off exactly the screen above. But also Qlikview, Power Pivot, COGNOS, and Adobe SiteCatalyst are great places to start. I've had training and experience with all of them, and they're all auto producing element/dimension/segment tools that let you drag/drop.

There are literally hundred's of books out there that provide training to Marketing professionals on the use of Google's Drag and Drop dashboard (going back to The Google Api v2, when it wasn't one large ecosystem.... And specifically, the bits on segments are what I think would seal the deal. That's the biggest difference between Pivot tables... you could set a table filter, but those couldn't be dragged around.

But of course... Excel Pivot Tables...

You must log in to answer this question.

Not the answer you're looking for? Browse other questions tagged .