3

US Patent Number 8,291,381 - Call stack parsing in multiple runtime environments

If multiple runtimes are sharing a call stack, their call stack frames may be different. Here, Microsoft proposes a debugger that asks each runtime/process if it made the frame at a given address. If it did, ask it to describe the frame.

Looking for prior art.

3
  • I think that your description: "if multiple processes are sharing a call stack..." is not accurate. In this case they talk about one process managed by different runtimes - probably they mean processes with mixed .NET (CLR) and native code, and a debugger that is capable of analyzing both native and CLR frames asking .NET runtime or native Win32 runtime for more data about given stack. (Nice and handy functionality BTW.) I guess that looking on some esoteric debugging tools might show similar ideas... Will look for that. Commented Jul 23, 2013 at 22:10
  • Mono Hard Debugger (mdb) looks interesting mono-project.com/Guide:Debugger
    – jasonk
    Commented Jul 24, 2013 at 4:03
  • @WitoldBołt Good point. Doesn't GDB have just-in-time features for debugging these situations? Like when you're debugging a python application -- you might see frames from the native API or the interpreter.
    – Not Mad
    Commented Jul 24, 2013 at 12:58

3 Answers 3

4

For reference, examination severely narrowed this patent application before it was granted.

Claim 1 as originally filed was quite broad. USPTO found quite good prior art with:

Examiner's argument against claim 1 as originally filed was that Goldin teaches all of claim 1 except requesting the at least one runtime to claim the first call stack frame, which would be obvious based on Ciernak.

Applicant denied this with an argument that stack frames in Ciernak were within a wrapper, which is indeed one way to make each runtime able to identify their own stack frames. Eventually, Examiner suggested amendments to claim 1 by adding the limitation where each runtime has a stack frame map which is used to determine if they should claim the stack frame. In other words, each runtime maintain a list of all stack frame. This makes perfectly sense, is probably obvious and/or ineffective, yet it is indeed supported by the description and not found in Ciernak.

However, we can find prior art on this very feature (and actually more of Claim 1) in:

Our argument is two-fold: (a) Alpern teaches that virtual machine maintains a list of routines and arguments (stack frames) and (b) the notion of stack frame map does refer to any additional technical feature.

Alpern describes a system with a centralized debugger for distributed virtual machines, where the code of one virtual machine may invoke code in another virtual machine, and thus we have a single stack. In some embodiments, each virtual machine maintains a list of routines and arguments on the stack:

In other examples, the debug request message is a request to execute a single step, or a request to list all loaded classes, or a request to list the routines on the stack, or a request to list the IDs of the variable objects associated with each routine on the stack.

Stack frame maps are not (technically) defined in the specification but by their usage, e.g.:

These memory addresses are recorded in a call stack frame map

Each runtime may consult its call stack frame map

They are additionally pictured and referenced as 172, 174, 176 in figure 7 (below) and as 182, 184 and 186 in figure 5B.
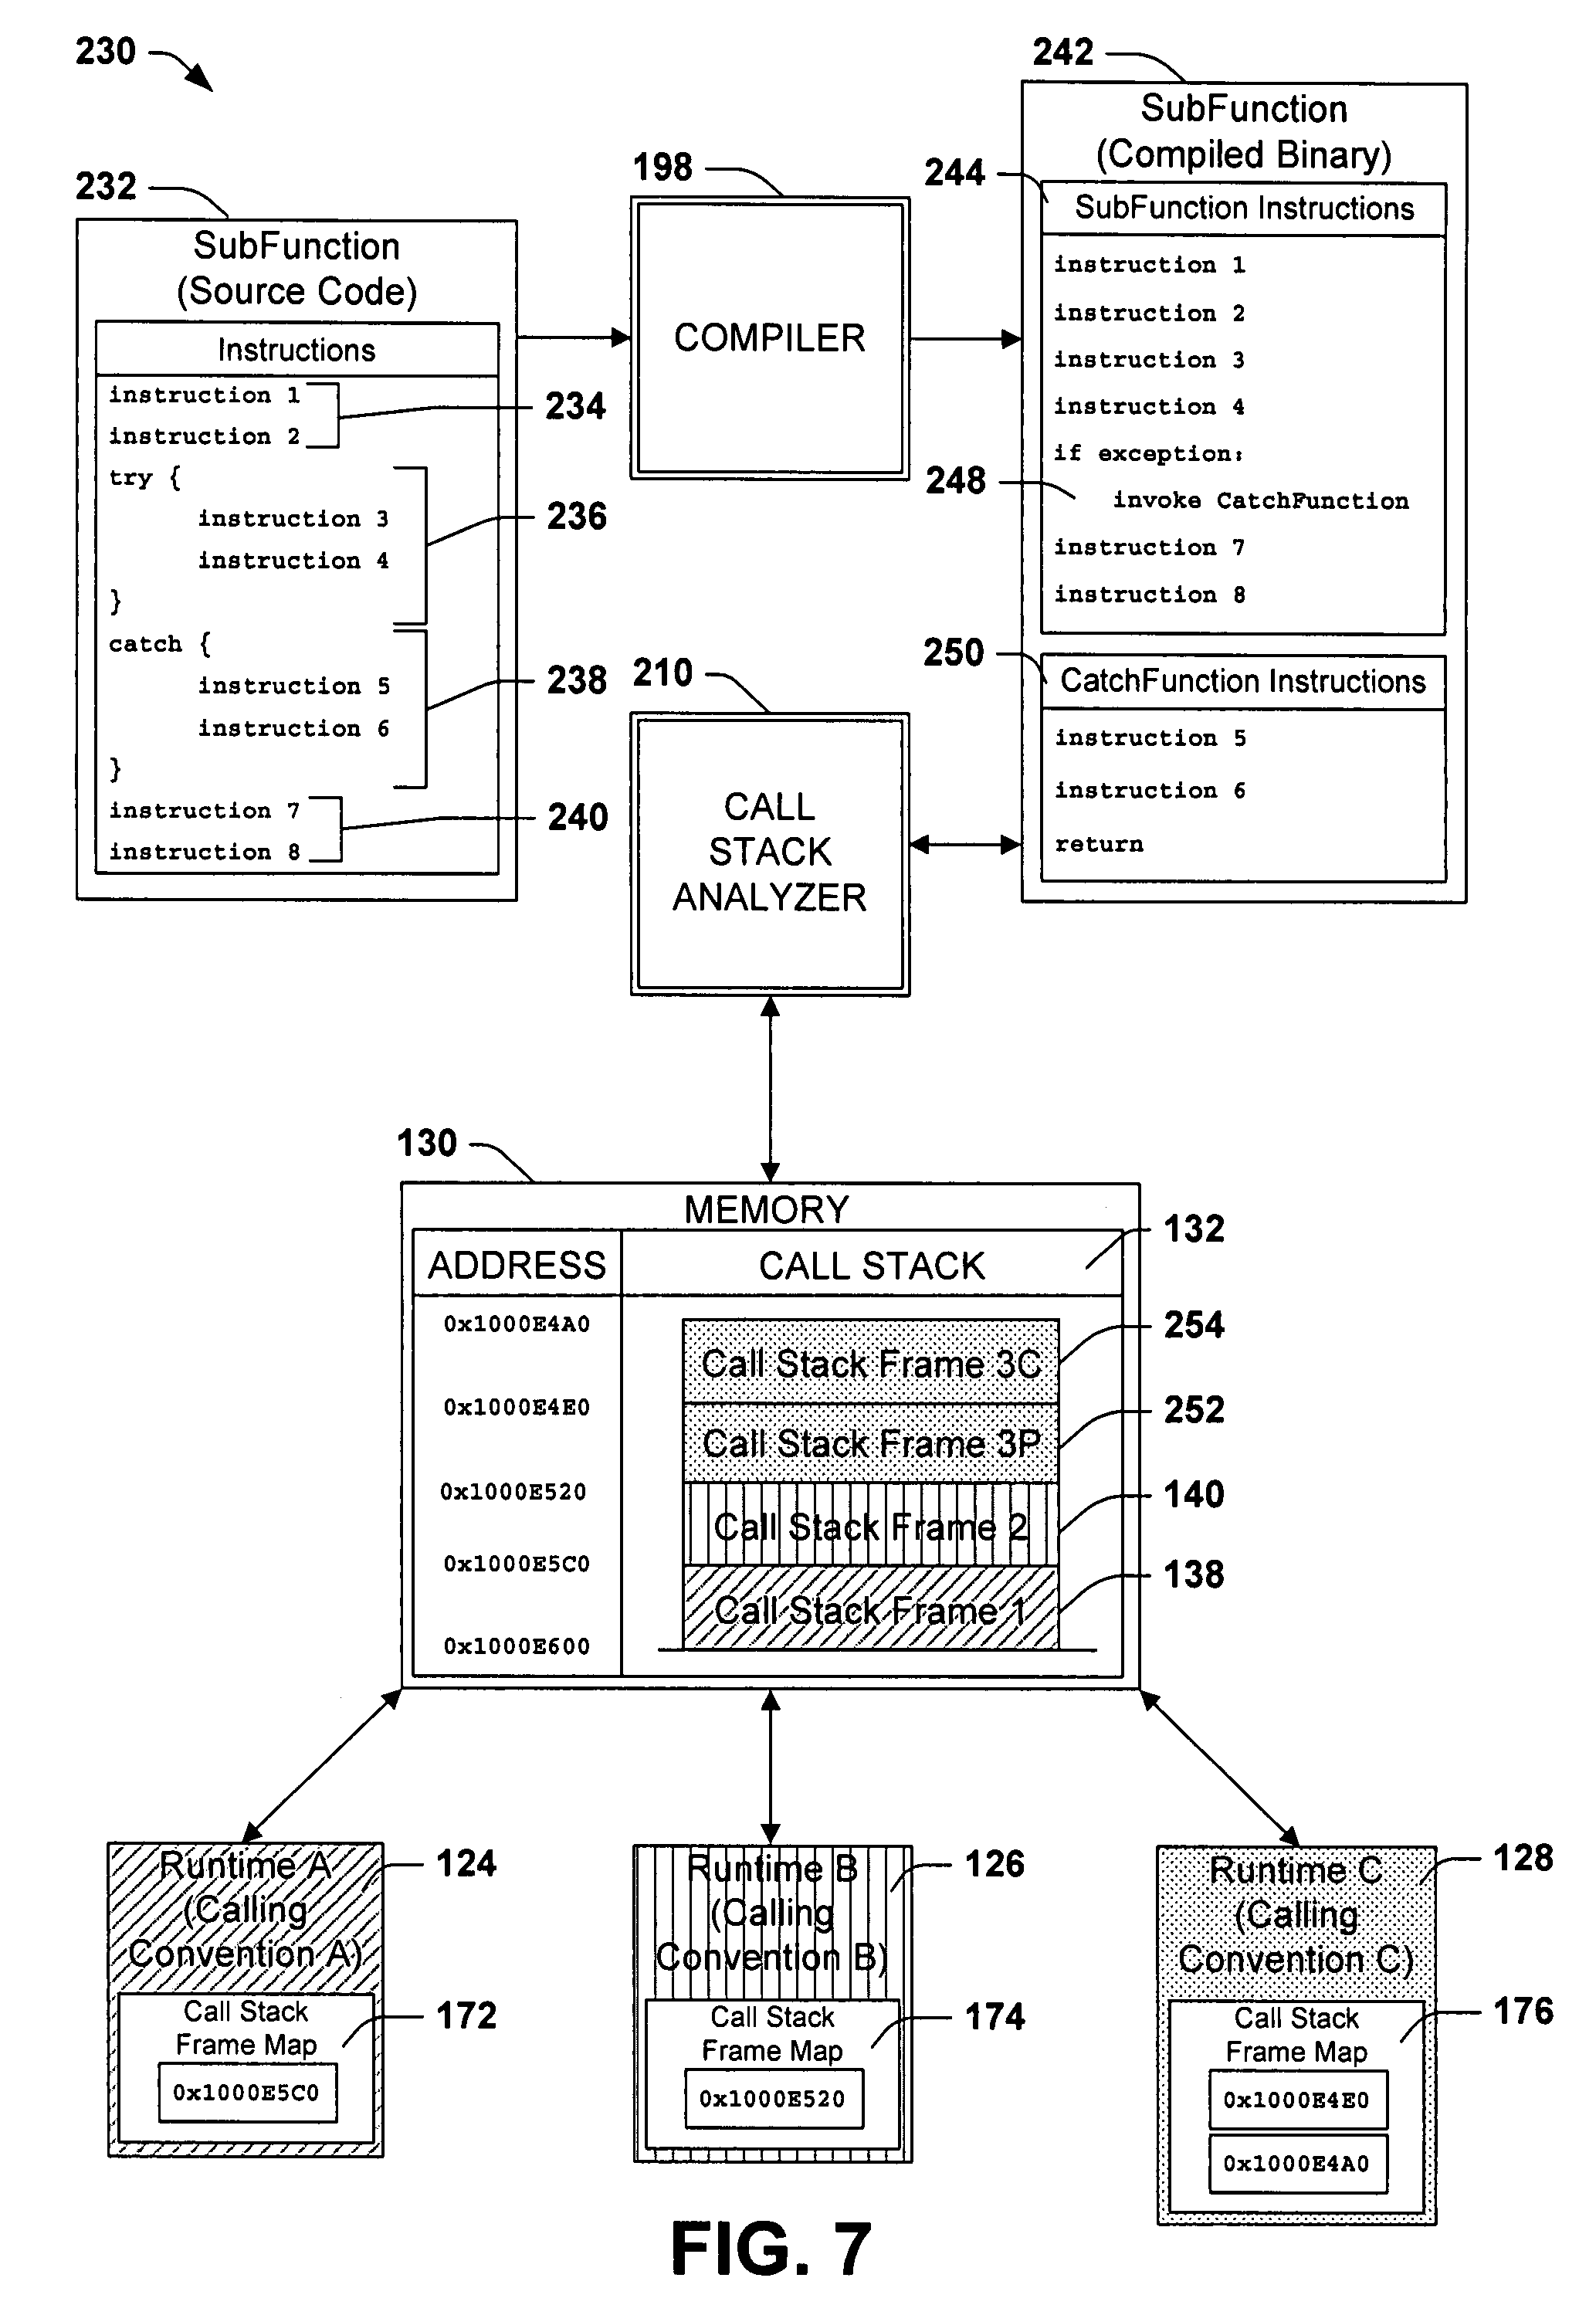
Stack frame maps as 172, 174, 176 in Figure 7

Applicant actually agrees that the notion of stack frame map is vague and does not refer to any specific technical feature (e.g. a hash map with a O(1) amortized access time), based on the following extract of the description:

However, it will be appreciated that those having ordinary skill in the art may devise a number of variations in runtime identification and claiming of call stack frames that utilize the techniques described herein.

3

It's probably worth looking into Mac debuggers from the PowerPC era. The first models (6100, 7100 and 8100) were released in 1994, and the last PowerPC product lines were replaced by Intel-based equivalents by the end of 2006, both before the priority date (2007) of this patent.

PowerMacs routinely ran old 68K code under emulation in the same process as native PowerPC code - indeed, for some time a good deal of the underlying operating system remained in 68K, running underneath otherwise fully native PowerPC applications. The first OS version shipped with them was System 7.1.2, a minimally fixed-up version of the existing System 7.1 with just enough PowerPC code to make the whole thing work. Other companies might quite reasonably have made a major revision to the OS when changing the CPU under it.

Mac debuggers were therefore routinely designed to cope with both native PowerPC and emulated 68K code simultaneously. To do this, they needed to be able to interpret the two very different calling conventions used by the two architectures (68K put arguments on the stack, PowerPC passed them in registers), and possibly even hook into the 68K emulator to determine the state of the emulated CPU. There was also at least one third-party replacement for the 68K emulator which was meant to improve emulation performance, and debuggers needed to continue to work with that.

The two debugging environments I remember using are MacsBug (by Apple themselves), and CodeWarrior. There was also MPW, but I never used that and I don't know whether it had it's own debugger, rather than relying on MacsBug.

-1

DTrace could be interesting here.

You must log in to answer this question.

Not the answer you're looking for? Browse other questions tagged .